One of the benefits of going to a smaller university like WSU is that you aren’t just a number; you are aren’t just one thread in a statistical blanket statement thrown over the diverse group of individuals that make up the WSU community.
But, just for fun, let’s take a look at these colorful graphs I made to show some of the demographics* of this year’s incoming class.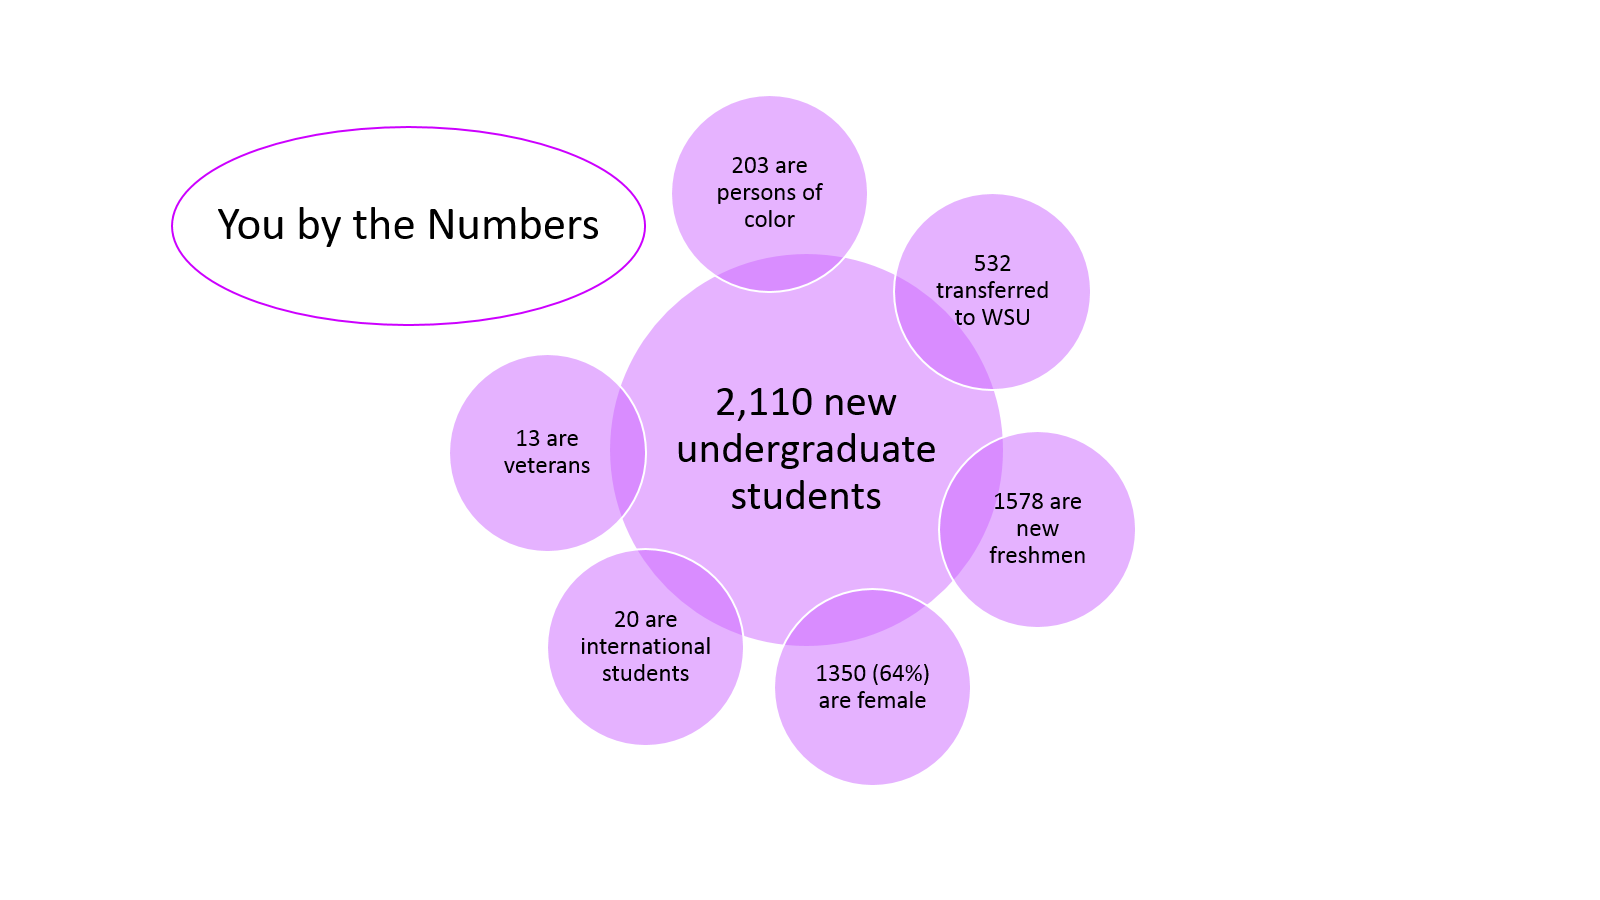
Wow, you can see here that there are A LOT of you! Most of you are female and freshmen, but even those comparatively few veterans, international students and transfer students all share the experience of being new to WSU.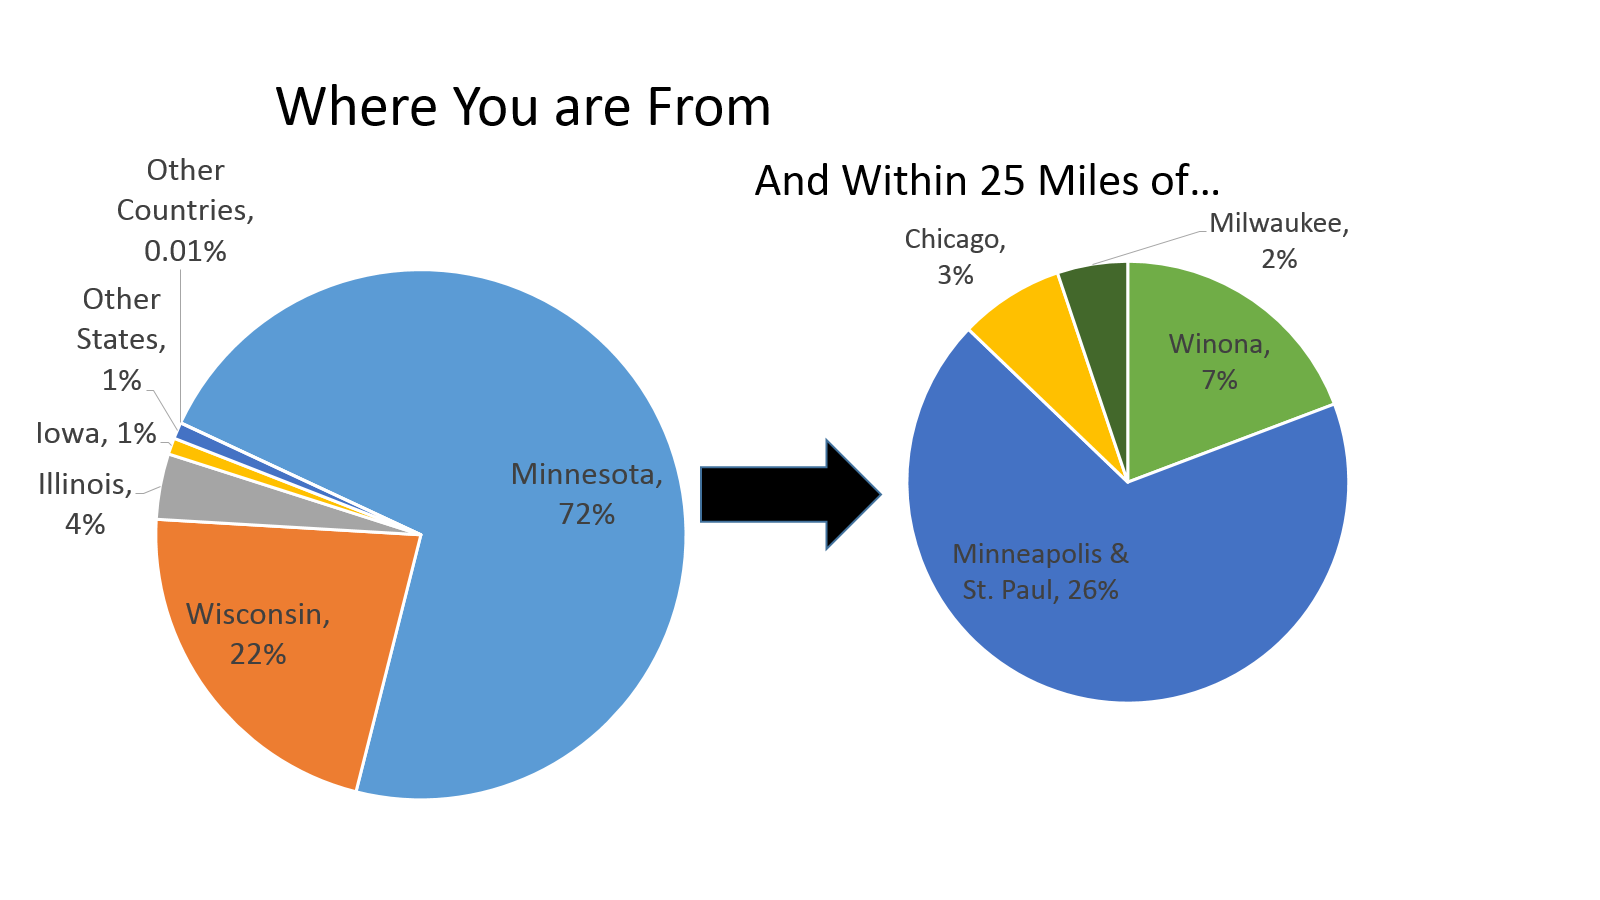
Ok so you are all here in Winona now, but let’s take a look at where you came from. Most of you came from Minnesota and Wisconsin, which is pretty typical for Winona State students. 26% of you should have no trouble finding rides home on the weekend since you are all from the Twin Cities area—lucky! (I am from a small town in central Wisconsin so my ride-share options are limited to only a handful of people.)
But some of you made a longer journey from home; in that 1% from other states, there are people from California, Florida and Massachusetts.
The others are international students. They hail from: 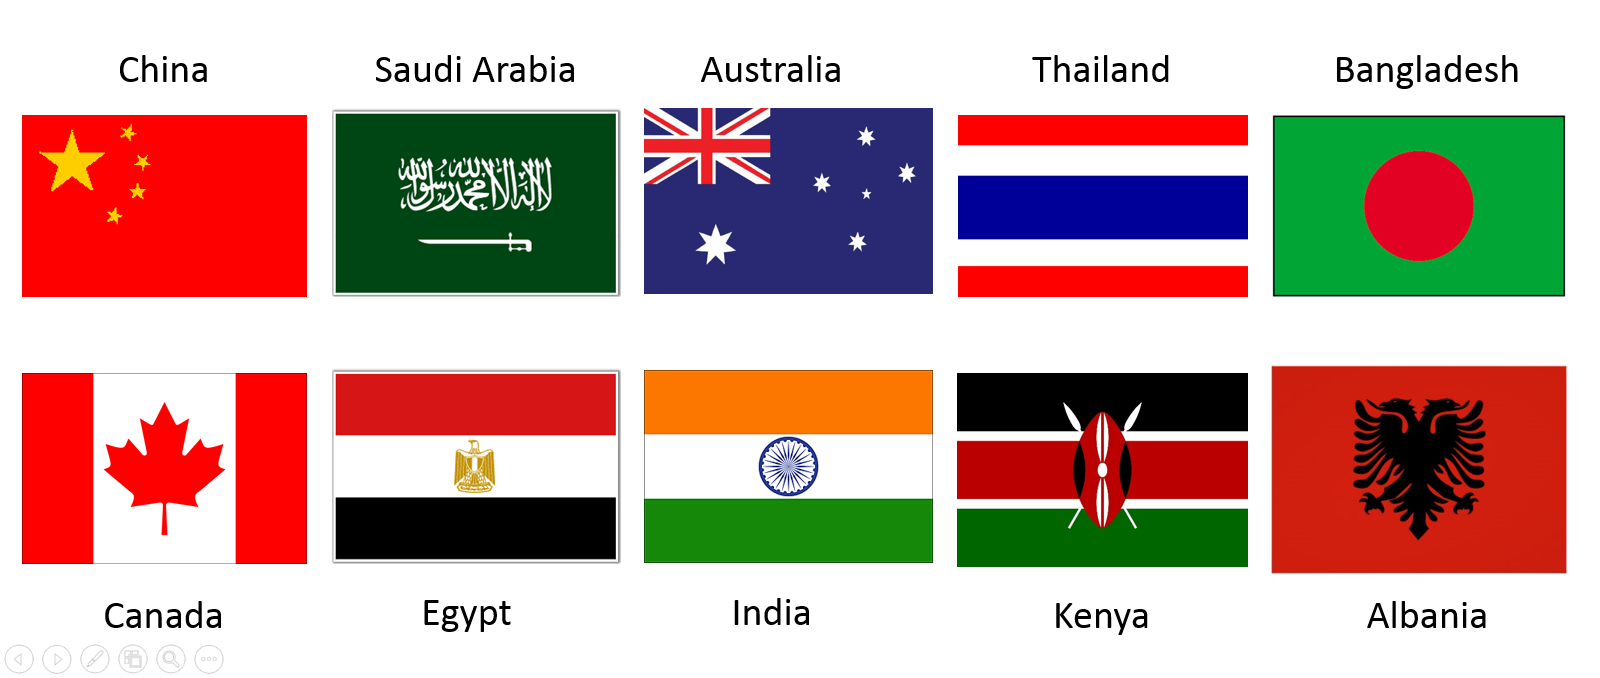 Now THAT’S a long trip home!
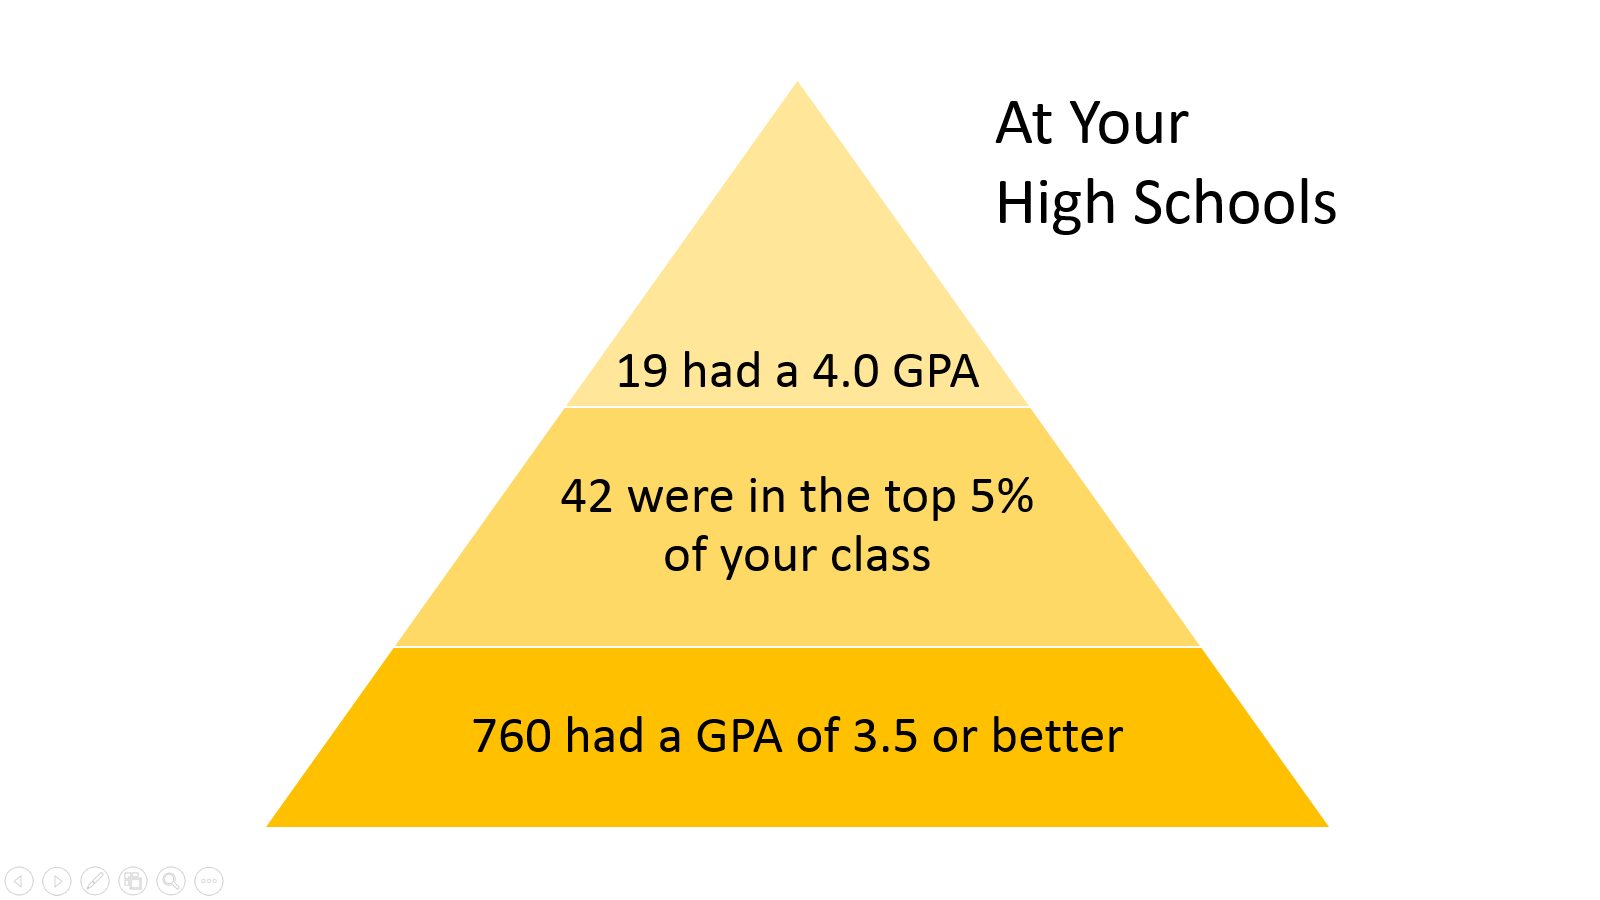
It seems that quite a few of you were academic achievers back in high school and some of you already have some college credit under your belts as 241 of you attended RCTC, 114 went to Southwest State and 85 studied at Southeast Tech.
Your academic ambitions in high school have translated into the following breakdown of your majors at WSU.
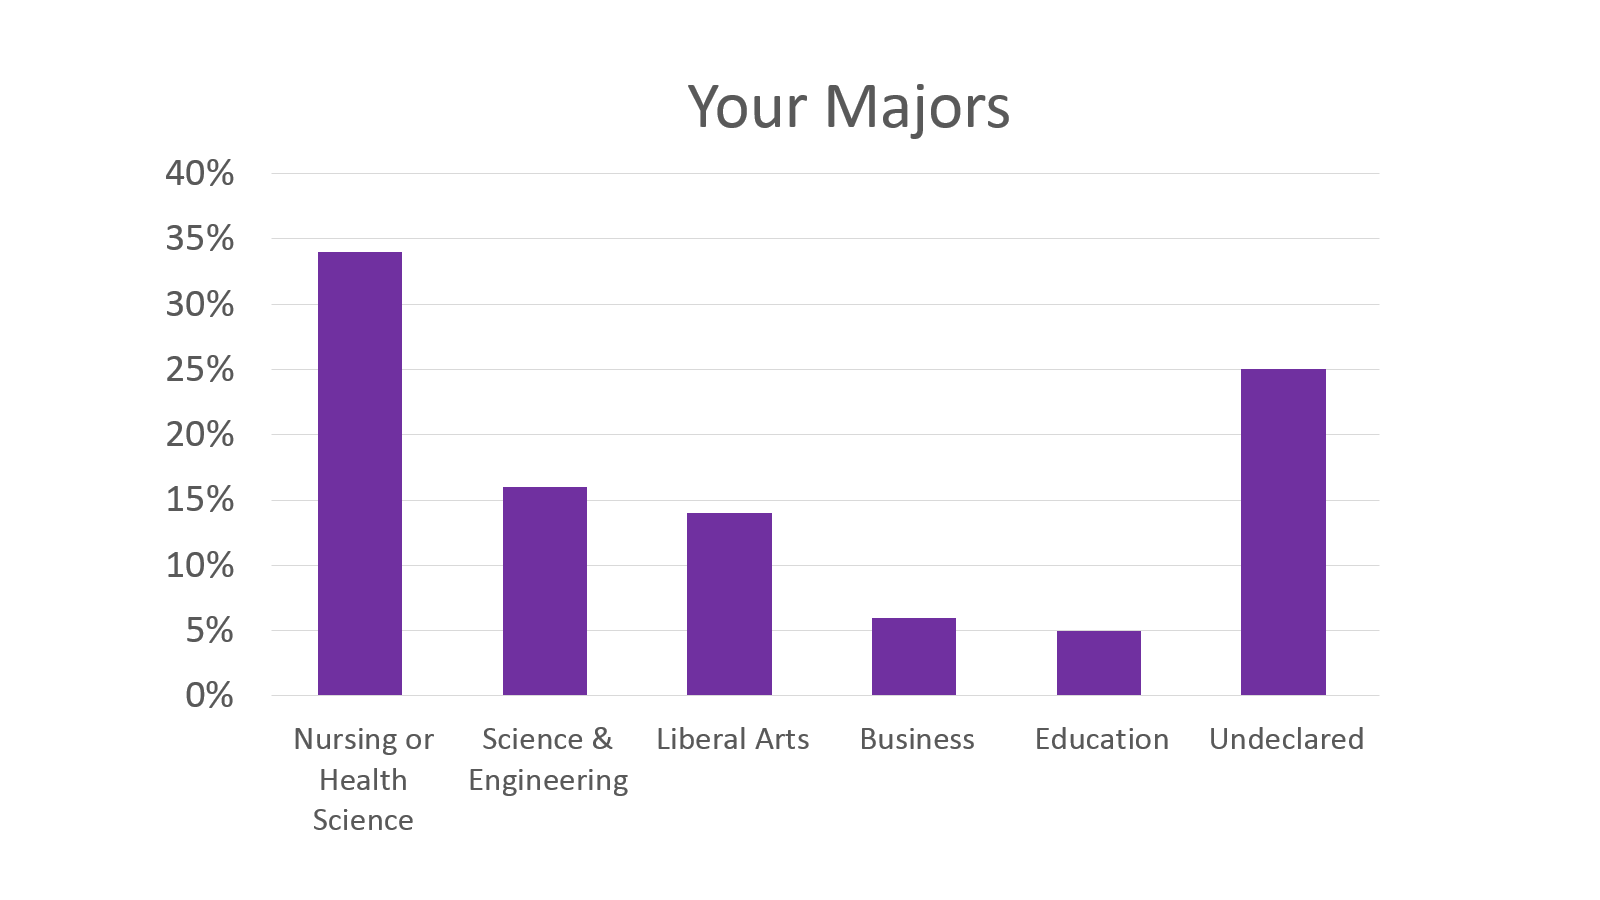
As you can see, your class is spread out among the five colleges, but most of you are pursuing a science or health-related degree. For those of you who are not yet sure what you want to major in, you are not alone!
A full 25% of you are undeclared, though soon enough you will join your brethren in Liberal Arts, Education, Business, Science & Engineering or Nursing and Health Sciences.
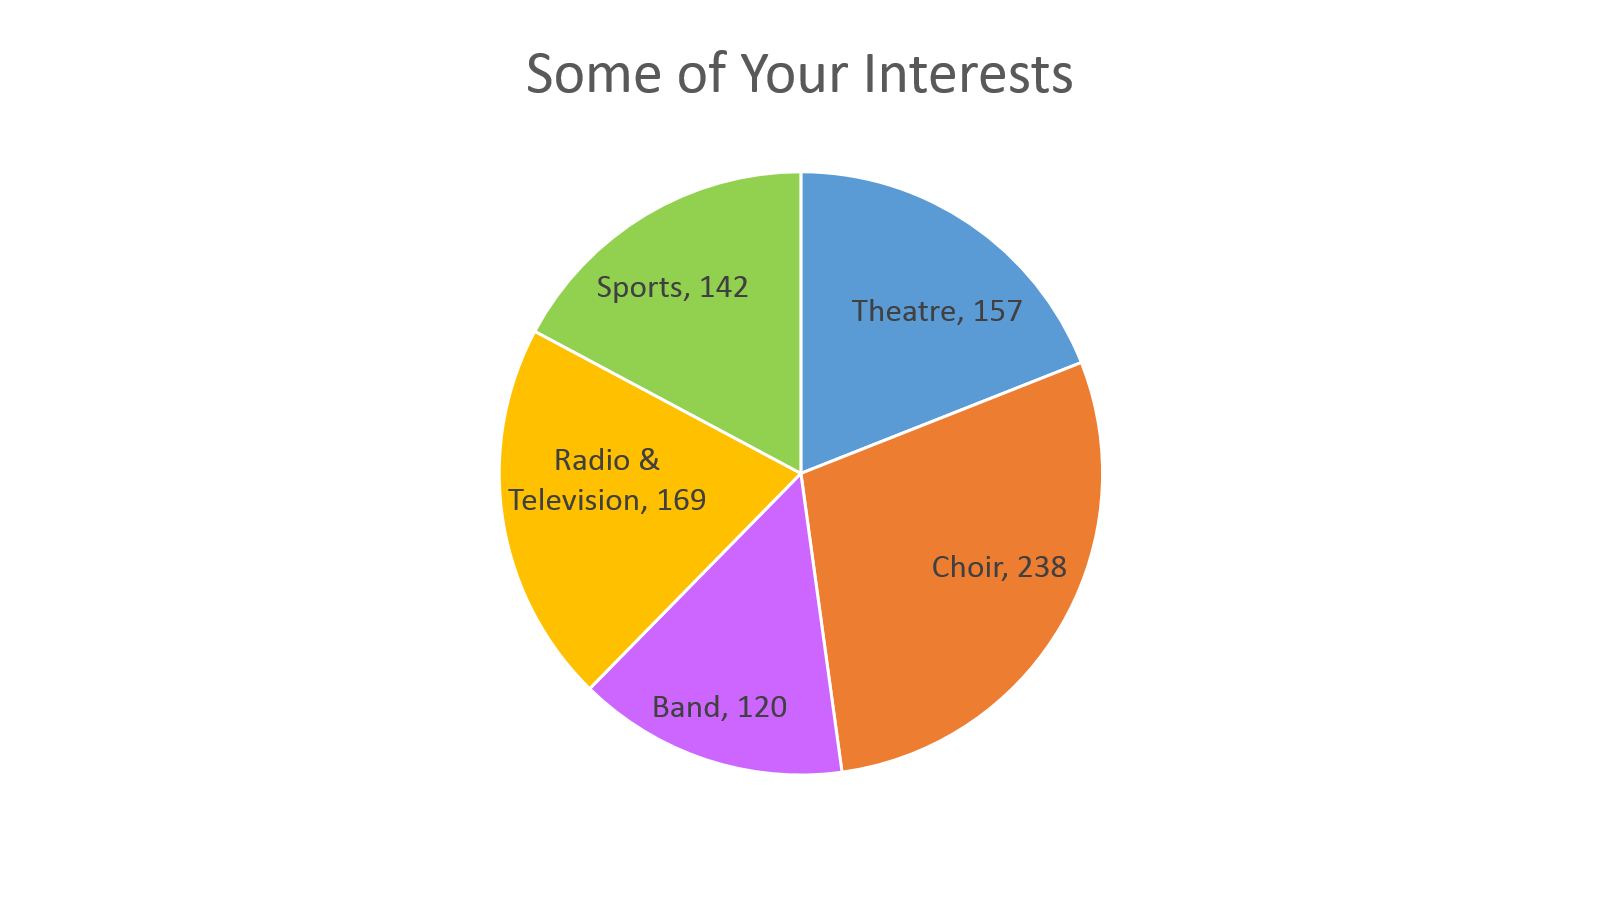
But of course, college isn’t ALL academics and studying all the time (though your professors might wish it!) When you take your breaks from the library, look at how you all are interested in spending your time.
There is actually quite a bit of overlap in your extracurricular interests.
So, while you are all individuals with unique perspectives and backgrounds, the graphs show that you actually have a lot in common with others in your class.
I know that it’s only a little over a week since you started this college experience and maybe you are loving learning how to live in an unfamiliar city and meeting new people but maybe all these unknowns variables are causing you to wonder where you fit in, who you can connect with to make those new friends that everyone tells you is an important part of the college experience.
I know that I did want to get away from and gain new experiences but inside I was worried that I couldn’t find people who were like me, who enjoyed the same activities, who valued the same ideals. I eventually did find my people and I now have a few close relationships that have given me an anchor here and made this next step of my life a joy.
I am not saying that the other 141 people interested in sports or the other 737 nursing or health science majors are going to be your new best friends but it is somewhere to start.
A typical English 111 class is, what 20-25 (usually) freshmen students? The likelihood that the person sitting next to you shares your interest in music or theater, as we’ve seen here, is pretty high so start a conversation in that five minutes before class!
Also, join a student club. Whether it’s one related to you major or just an activity you enjoy, it’s a surefire way to find people with whom you can connect. If you are feeling like you can’t seem to find someone who “gets” you, take look at the numbers.
You are have more in common with your peers than you think.
*All data represented in this blog post are unofficial numbers pulled together before classes started for entertainment purposes and do not represent official demographic data for Winona State University.